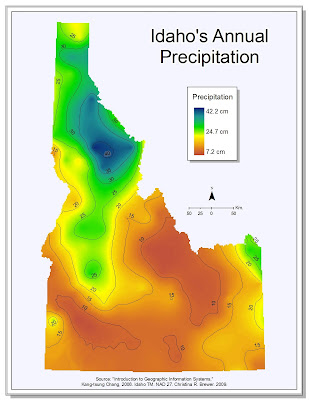
Annual Precipitation - inverse distance weighting
This map shows annual precipitation throughout Idaho. The map clearly shows lower values in southern Idaho.
I chose to symbolize the background in a way that hopefully communicates the subject matter, but also conveys trends across the landscape. I also added a light grey background, which can help to keep Idaho from fading into a sea of white.
Although I would have liked to include the year of the data the year was not provided. I experienced trouble with the legend. I would have liked to make is a horizontal color ramp, but all attempts were thwarted. I also had some trouble with the contour labels. I still think that there might be too many labels. Intropolation method was that given in lab intructions: inverse distance weighting.
Annual Precipitation - Kriging
This map also shows annual precipitation in Idaho. However, the interpolation is creating using kriging, rather than inverse distance weighting as before.
The overall trends are still intact, but perhaps with less detail.
For this map I chose to stick with my layout from the previous map. I was somewhat pleased with that layout and repeat layout use can speed the cartographic process. The man thing that is different in this map is the contour labeling. I went with the same basic styling, but made more effort to align labels in succession at certain locations. I believe that this may help to give the second map a cleaner appearance than the first map.


No comments:
Post a Comment