Introduction
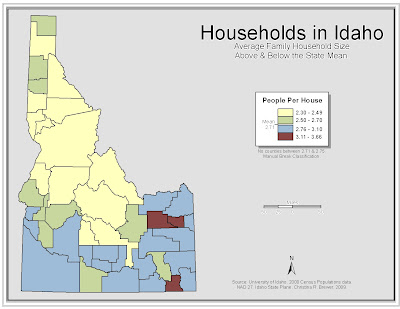
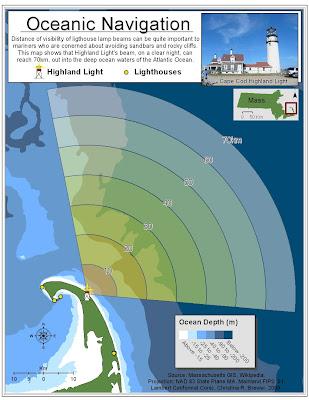
Maps show a variety of phenomenon within a spatial context. These to project maps shall show two very different, but interesting spatial features. Map 1 is a depiction of counties in Idaho with household sizes above and below the state’s mean household size. Map two is a multivariate map that shows the range of a lighthouse beam along with the varying ocean depths where the light may reach as well as surrounding waters.
Background
Map 1 displays average household size in each Idaho County and whether that county is above, or below the state average of 2.71 people per household. Values seem higher in the south and especially southeast portions of the state. This means that the average household is higher than the state average of 2.71 people per household.
This map is not meant for high end analysis. It can be used as a general, fast reference. This map was not designed for the purpose of textbooks, although it could be used for a human geography textbook, showing geographic phenomenon of social norms related with certain people groups. Map viewers should be able to see the trend over the state and understand where greater than or less than average values occur. My data was not adequate to establish an absolute conclusion.
Map two is a reference map showing the beam range of Highland Light on Cape Cod, Massachusetts mapped over nearby oceanic depths. Lighthouses are a navigational aid of mariners, as such, mariner are concerned about ocean depth and light visibility. This map shows that this lighthouse is easily visible in deep water, avoiding risk of sandbar grounding of vessels.
Map 1

Map 2

